Monday, 31 March 2014

What's green, glows in the dark and is found in jellyfish?


The molecule for this month is GFP, the green fluorescent protein from the jellyfish Aequorea victoria. This protein has generated considerable interest in experimental biology, and its applications in cell biology in particular warrant its inclusion as a molecule of the month. It is a naturally occurring protein with a function that remains controversial in its normal host organism. However, by combining the power of fluorescence detection with gene fusion and cell transfection technologies, the GFP has made the experimental investigation of cellular processes much more illuminating!


So how does it work? First we need to understand fluorescence. If you look at the definitions of fluorescence, they require you to understand luminescence. So first, luminescence is the emission of light without the input of heat. This is in contrast to incandescence, which is the emission of light that arises when you heat a metal object, such as a light filament. The energy input in the case of fluorescence is electromagnetic radiation: the absorption of a photon of light leads to excitation which is followed soon after (usually in a few thousandths of a second or less) by the emission (or release) of light at a longer wavelength (remember the longer the wavelength, the lower the energy). For completeness there are two other phenomena that are similar. Phosphorescence is very similar to fluorescence, but instead of an almost instantaneous emission of light, there is a delayed release, which is a consequence of a different pathway of excitation and relaxation of electrons in the molecule. Chemiluminescence is the emission of light during a chemical reaction (this is important in some forms of DNA analysis and in the detection of antigens using some antibodies).


The beauty of GFP, is that the physico-chemical origin of its fluorescence does not require the addition of a co-factor: it is entirely embodied in the primary structure of the molecule. Hence, by introducing the gene encoding GFP into any cell, there is no metabolic barrier to eliciting a fluorescent signal. There are of course other reasons why a recombinant GFP might not express its fluorescence, including failure to express (as a gene, or as a translation product), degradation in the host cell by proteases. It is also possible that the expression of GFP is not coordinated in time or space with the process being investigated. But, most of these hurdles can be overcome by systematic investigation. Professor Roger Tsien (who shared the Nobel Prize for his work on GFP), published a subtle mutational variant of GFP in which a serine residue was changed to a threonine. This led to a significant improvement of the GFP in respect of its spectral properties: this mutant forms the basis of most applications of GFP in molecular cell biology. You should think carefully about this mutation by looking at the structures and considering the fact that in contrast to GFP, these two residues are "viewed" as essentially the same by many protein kinases.

Perhaps the most powerful application of GFP is the the revolution GFP has brought about in biological microscopy. Pre-GFP, it was extremely difficult to identify molecules under the light microscope. The methodology often required combining antibody recognition, with the use of small fluorophores such as fluorescein. However, this methodology is specialized, relatively expensive and time consuming. By coupling GFP to a target molecule (using relatively simple cloning technologies), it is now routine to identify a protein molecule and observe its behaviour in the cell. This can be useful in the study of drug targets, fundamental understanding of the role of a protein in time and space and in identifying the way it interacts with other proteins. It is in fact possible to "tune" the fluorescent properties of GFP making it yellow or red! The advantage of this, lies in the ability to measure protein proximity, by the fluorescence changes that can often be observed when two fluorophores come together. This phenomenon is called fluorescence resonance energy transfer, or FRET.


Scientists at MIT, use GFP to monitor 
cell death in their search for new drugs
GFP is a classic "reporter" of events in a Biological experiment. That is a molecule providing indirect evidence for the activity of another protein or gene, a cell or even an entire organism. For example by introducing the GFP gene on a plasmid molecule, that may contain another gene of interest, we can be confident that the cell has taken up the DNA. If we insert the GFP gene downstream of a gene that is switched on in the presence of a hormone for example, then we can investigate that gene expression process and even target it for drug development. We can couple GFP to genes that are thought to play a role in the development of an organism and monitor the timing and location of expression. GFP has truly transformed Molecular and Cellular Biology and its impact. You can see the images used by Professor Tsien in his Nobel address here.

Saturday, 22 March 2014

Science is global, so how do the nations compare?

Science is a global activity, it always has been, but as with most competitive activities, if we take a historical snapshot, there will be one or two countries that make the greatest contributions. If we look at Science from its origins, then the emergence of the foundations of mathematics, physics, chemistry, biology and medicine can be traced back to the Middle East, China, Greece and India. The early developments in Science where largely driven by a human desire to understand the motions of planets and the Natural world together with our own bodies. Moreover, the developments in mathematics by the Greeks and Babylonians; Euclid, Archimedes, Pythagorus and Kiddinu, had enormous implications for engineering, navigation and architecture. 

The next most significant period was probably the age of enlightenment during which time Galileo and Newton (amongst many others) developed a platform for modern, experimental science, founded on robust mathematics. From a biological perspective, I think most would agree that the development of the concept of evolutionary theory, alongside an appreciation of geological time scales set the stage and focus for our current experimental investigation of biological phenomena. I would encourage you to look at the many interesting internet resources (start with a search for the history of science and wikipedia). As a student, I was particularly taken with the 1954 book, Science in History by the eminent X ray crystallographer JD Bernal (pictured right), which provides a thoughtful and stimulating survey of Science through civilisation. I also recommend Jared Diamond's more recent book, Guns Germs and Steel as a scholarly study in why some humans seem to have acquired more "stuff" (or cargo, as he puts it!) than others. I shall post some books that you may wish to read in subsequent Blogs.


If we look at modern science, let's say the last 100 years, it has been a period in which time Newtonian physics has been overshadowed by quantum physics and molecular biology is beginning to challenge chemistry as the Science underpinning manufacturing; not forgetting the Turing-led computer revolution! So the first half of the last century was Euro-centric, whilst the second half was dominated by the USA. It is clear that cutting edge science is becoming increasingly global and is closely linked to economic power. So, whilst stem cell science surfaced in laboratories in the USA and Europe, the Chinese and Koreans are investing massively in these areas (see the 5 circles of patent hot-spots, top left). And those nations who manage to translate their investment in these contemporary scientific breakthroughs into wealth creation and sustainable improvements in the quality of life of their citizens, will surely be the dominant political forces in years to come.

I am going to take a look at how different nations and groups throughout the world conduct science through interviews and exchanges with professional scientists. For example, Professor Vladimir Kramarov and his longstanding colleague Dr. Konstantin Ignatov are two Russian scientists whose research on the development of novel application of enzymes in molecular biology, has been carried out under very challenging times in Moscow. They have agreed to give us an insight into Science in Russia. I will be talking first with Dr. Antal Kiss, from the Biological Research Centre of the Hungarian Academy of Sciences in Szeged (group photo left, Antal is on the right), whose group works on synthetic and systems biology, with a focus on engineering nucleic acid modifying enzymes. Despite the difficulties in obtaining laboratory funds in Eastern Europe and the former Soviet Union, the quality of the science in these two laboratories is remarkable, largely as a result of their commitment and passion for Science.  It is also a consequence of the great traditions of Science in Russia and Hungary and it is important to understand how different nationalities and cultures have contributed and continue to contribute to the body of scientific knowledge. I shall shortly give you an insight into work from these parts of the world through my UTC Blog site.

Monday, 17 March 2014

Y12s welcome Professor Phil Ingham to the Innovation Labs

During Thursday morning this week (20th), I am delighted to announce that we have Professor Phil Ingham visiting the UTC Innovation Labs. Take a look at his guest Blog, from a few weeks ago. Phil will be meeting staff and Y12 students during the lab class on Thursday morning. 

Phil has made major discoveries in the field of developmental biology, using genetic methods and model organisms ranging from Drosophila to Zebra Fish, to dissect the molecular and cellular pathways that underpin the fundamental steps in development. 

Let me know if you want to meet him, otherwise I will show him round the lab as we begin to extract genomic DNA from Synechocystis, and test its suitability for PCR with primers targeted to a specific set of photosynthetic genes.

How to organise and package a genome suplement!

The Y10 class have been sharpening their lab skills by using restriction enzymes to cut the genomic DNA of bacteriophage Lambda and analyse the sizes of the DNA fragments produced, using agarose gel electrophoresis. We refer to this as restriction mapping and it widely used in Molecular Biology to analyse genes, clone genes and to compare regions of two or more plasmids and viral genomes. The skills required include experimental planning, careful pipetting of one thousandth of a ml samples, and the loading of these samples onto agarose gels. I have reported on progress earlier. In the forthcoming class we are going to look at the analysis of data in detail. Not only shall we determine fragment sizes on gels, we shall also look for patterns in the data, as we assemble the restriction digests into a linear order. In addition we shall use the formulae developed by Archimedes over 2000 years ago, to calculate the volume of a genome and the theoretical space occupied by viruses in their host. 


Assembling the lambda genome from restriction mapping data can be frustrating, owing to the difficulties in sizing DNA fragments on agarose gels. The problem is that whilst short DNA fragments do migrate at a faster rate than larger fragments, the relationship breaks down over the range of fragment sizes we wish to analyse (see left). You can plot the distance migrated by a group of fragment of DNA on a gel and you will notice the relationship is non-linear. Simply, small, adjacent fragments appear to be better separated than large adjacent fragments (look at the fragments 1371 and 1264, compared with the bands at the top of the gel). As the size of the DNA increases, the separation achieved by conventional electrophoresis becomes less effective. For this reason, size standards that match the DNA fragment size under investigation are used. Alternatively, in order to overcome this problem, the use of sophisticated power supplies, which pulse the electrical field may be used.

The lambda genome contains just under 50 000 base pairs and since DNA can be approximated to a cylinder, it is therefore possible to calculate the volume of the genome (let's forget the charged surface for now and assume it is a simple cylinder) using Watson and Crick values for the diameter of the duplex and the number of base pairs in a repeating unit. We also know from the pioneering electron microscopy work in the 1950s, the dimensions of the phage head, or capsid and the volume of a typical cell (let's assume both can be represented by regular spheres of 60 and 1000nm respectively). So if the diameter of a DNA duplex is 2nm, 10 base pairs repeat every 3.4nm, we only need the equation for the volume of a cylinder (and it is still pi week!). We might then calculate the volume of the capsid and cell and think about how the DNA is packaged and the maximum number of phage particles that can be squeezed into a bacterial cell (for this you will need the formula for the volume of a sphere). 


1  2   3  m
The first thing I realised is that the restriction digests are still proving to be a little demanding (compare Lanes 1 (perfect), 2 (partial) and 3 (uncut) across the whole class, with some notable successes (see left) and some problems still persisting. The partial is a result of insufficient enzyme, incomplete incubation or inaccurate addition of water/buffer. The uncut DNA is more worrying, but I suspect resulted from a failure to add the enzyme. The lesson here is to take more care over assembling reaction mixtures and if you are unsure about using any equipment, please ask first! On the positive side, we are getting nice gels and the experiment is probably working for 50% of the groups. Take a look at your lanes on the class data for today (Innovation Portal) and make sure you note whether your sample gave the predicted pattern and comment on whether the reaction went to completion of not.

I was pleased to see that the maths part of the session went so well. I realised that graph plotting and the use of logs and log graph paper is completely new to you, but the number of students who elected to use semi log paper was very satisfying. I think we are starting to see evidence emerging of the value in thinking about the best way to plot data and your ability to observe trends in data (here it was the non-linear migration of DNA fragments in agarose gels). The 2 cycle semi log paper might be improved on if we use 2 cycle on both axes next week. I also decided to stretch you on the volumetric calculations: determining the volume of the cylinder that best describes the linear lambda genome of 48,500 bp. You solved this pretty quickly and I could see that you then found the calculations of the volumes of phage capsids and bacterial cells (assuming they are regular spheres) was then straight forward. In the end, I felt that we had come away with an appreciation that some numerical relationships in Biology are best described in non-linear terms and that there is significant value in being able to calculate lengths and volumes in order to firm up your understanding of size relationships as we consider the molecular and cellular basis of phenomena phage and viral infection mechanisms.

Friday, 14 March 2014

First week of the Synthetic Biology Project: PCR success!

It was a foggy on Thursday morning when I walked into the Innovation labs and Michael was distributing the reagents, template, primers, dNTPs etc. The Y12 group were due to arrive in an hour and by the end of the afternoon, all of their skills training would be put to the test. I also had to fit in an explanation of the fundamentals of DNA replication: the enzymes, the concept of primers and the polarity of DNA synthesis, not forgetting the logic of the thermal cycling process. By 10am the student teams had assembled all of the reactions and the new PCR machines were cycling (only for the second time!). By 1.30pm the gels had run and the results were in! Out of the 16 groups we had two failures, which I think is pretty impressive and one of the gels is shown on the left. No need for labels, the PCR product is clear in all but one reaction mixture. This means that we have now worked through all but one of the Y12 target methods, (ligation and transformation the only experimental method that we have yet to complete before Easter vacation). With these methods in hand we can now isolate the gene encoding non-ribosomal protein synthesising machinery from our Blue-green algae. Moreover, Y13 is set to become a great opportunity to exploit these skills and pursue a range of customised projects.

But back to Thursday. The Polymerase Chain Reaction (PCR) results in the sequential amplification of DNA through the polymerisation of new DNA strands, driven by a heat stable (thermostable) DNA Polymerase. Two strands of the template duplex are denatured and form the templates for primers and polymerase to generate copies. Two strands become, 4, 4 become 8, 8 become 16 and so forth until millions of copies are produced in a matter of hours. Not only does this facilitate DNA analysis, it is the core of many diagnostics and forensic methods. In short, it is possibly the most widely used method in Life Sciences today. But it also provides an opportunity to appreciate mathematical relationships.

DNA amplifies in an exponential manner, but the use of logs and their value in plotting data that span large experimental ranges, is not covered by the National Curriculum, unless you take Maths A level. No surprises then that understanding pH, or estimating binding affinities and physical relationships in Biology, essential in many diagnostic and analytical procedures, proves so challenging for first year undergraduates  and new lab technicians. So I am delighted to say that we used our time in between amplification and electrophoresis, to explore the value of logarithmic plotting methods (a picture of school log tables is shown left, for those of you over 50!). We plotted fragment migration on gels, we have previously looked at bacterial growth curves and what was really encouraging was the enthusiasm the students expressed for "having a go" at something that is often perceived to be too challenging. So, not only did we get the technique of end point PCR nailed, we have paved the way for understanding real time PCR analysis and more generally, non-linear experimental data, which pervade Biology. 

Friday, 7 March 2014

You've got to admit, we're getting better....

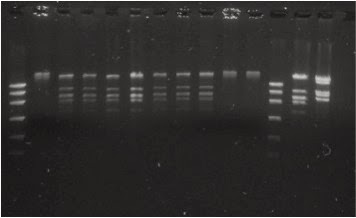
Those of you who have to suffer the annoying comments from your granddad, or your mum about how pop music isn't what it used to be since the Beatles split up, might recognise the title of my Blog today (nearly, from Sgt. Pepper's Lonely Hearts Club Band). What's my point? The Y10 class carried out the second day of their lambda genome mapping project last Tuesday. On the first day, I inserted a skills test to assess each student's ability to set up and analyse a restriction enzyme digestion of lambda DNA. The results are compared below. This strategy has been introduced into the projects to measure the development of your skills. The ability to deliver micro-litre volumes of nucleic acids and restriction enzymes, followed by loading onto agarose gels, might be something professional laboratory scientists do every day, but isn't common among 14 year olds!


Week 1 (left)
Week 2 (right)


So how did yo do? Above, on the left is an example of a gel in which you digested lambda DNA using the enzyme EcoRI (in week 1): on the right is the gel analysis of the same experiment carried out a week later. I don't think I need to say anything more about the level of improvement! Congratulations to all students in the class, this is an example of how data of a "publishable" standard can be achieved in the Liverpool Life Science UTC labs with dedicated students honing their skills through our Innovation programme: at the age of 14!

The images on the right are taken from open access publications and show the quality of the class data above (week 2) compare favourably with professional science labs. The first (left) is from a well respected journal in the Tropical disease field and the second (right) is from a University undergraduate team entering an international molecular biology competition. I think you will agree, we are on our way!

Why should I go to a seminar when I could be....

Research seminars are one of the most powerful means of presenting and discussing scientific data. They have been around for many years and as a conservative estimate I think I will have been to over 3000 since I started my career. Some have been given by undergraduate students, many by PhD students and the majority by academic visitors to the various Institution where I have worked, in Europe and the USA. At best a seminar can provide insight and inspiration, at worst a seminar can be shambolic, delivered in a rambling, disorganised manner based on poor quality data. Maybe it surprises you but both ends of the spectrum can provide equally valuable experiences. However, what is more important at this stage, is that everyone participates in the UTC seminar programmes, whether it is attendance at a Master Class, presenting your own project work, listening to your colleagues and most importantly, actively participating in the question and answer sessions.


We had the presentations on Thursday from the Unilever project, in which you were all asked to investigate the antibacterial activities of plant extracts of your choice. The project introduced you to methods of screening bacteria, methods of extracting water and ethanol soluble compounds from biological material ; it also incorporated a wide range of transferable lab skills and generic skills, including time management, sample labelling and storage (as discussed in an earlier blog). The presentations were all excellent and we (me and the teachers who were present) selected the Perutz and Hubble teams to go forward to present to the industry sponsors. It may sometimes seem unfair when presentations and posters are judged in this way, but that's how it is in the outside world! The successful award of research funding and the acceptance of published work in scientific journals is highly competitive and is typically judged by the process of "peer review". One of my jobs is to make sure that you leave the UTC fully aware of these issues and "match fit" for a career in the Life Sciences sector.

What made those two presentations the winners? The
overall quality of the presentation was an important factor, clear information and images on each slide, rather than large amounts of difficult-to-read text. We looked for imaginative ways to convey the significance of your results and the way in which methods and background research were explained. The final (and for me most important) criterion was data analysis and presentation. Your use of graphical methods to extract the significance of data and to quantify outcomes was a key aspect in the selection of the winners, but importantly compared with the last presentation session, I saw major improvements across the class, in your understanding of the Science that we are exploring.


How can you improve on the presentations? Apart from the issues of clarity of explanation on the slides, one simple way of improving is to practice! The use of unfamiliar technical terms can be overcome by asking me how to pronounce it, or alternatively listening to it being spoken through an online dictionary. The other thing to avoid is reading out text and facts etc that you do not understand. I listened to some nice explanations of some difficult concepts, but when I pushed you in the Q & A sessions, on occasions some of you were reading out lines with little understanding. I know that you are being stretched, but try and keep to what you know and anything you are unsure about explaining leave out.....for now!


Why is it not only important to give presentations but also important to attend those of others? First, we can all learn from others, at all stages in life. I have learned huge amounts from talking to students, staff and colleagues at all levels in my career and hope I continue to do so.  [I have really developed my understanding of molecular spectroscopy by having to prepare classes and field your questions on the properties of organic dyes.] A seminar may have an interesting presentation style, and may make use of novel ways to explain challenging phenomena. On the other and you can see how some things don't work and you can avoid them in your own talks. By attending seminars and presentations in the lab, you are not only being respectful to your colleagues, you are also giving your support! If you want them to listen to you and engage in questions (the added value of seminars), you should respect them too and come along to their presentations. Constructive criticism at the UTC in a supportive culture is, in my own view, one of the best ways to prepare you for your working life. In short, if you want to be a well rounded scientist, you must embrace the seminar culture wholeheartedly. 

Finally, for all of the above reasons, your commitment and performance at the UTC will include an assessment of your engagement in the seminar programme.